Interactive protocols for distributed energy resource management systems (DERMS)
Abstract
This paper proposes a novel approach to designing technical and financial protocols needed to support the penetration of distributed energy resources (DERs). It first formulates a complex, hard-to-implement, centralized decision-making objective for providing end-to-end electricity service. It then introduces a new taxonomy of an end-to-end interactive operations planning framework. The taxonomy rests on the dynamic monitoring and decisions systems (DyMoNDS) principles for supporting interactive protocols of (i) end-to-end interactions within a complex, multilayered multi-voltage power system; (ii) dynamic energy resource management system (DERMS) interactions with their DERs as well as with the bulk power system (BPS) operators; and (iii) DERs interactions with DERMS. The distributed model predictive control for creating physically implementable cost functions is essential. Also, the minimal coordination of different layers utilizes an AC optimal power flow that is essential for ensuring power flow delivery. We next provide a proof-of-concept illustration on the IEEE 14 bus system augmented by two standardized microgrids of the proposed interactive protocols, and their potential use for enhancing dynamic host capacity (DHC). While novel, this approach is a natural outgrowth of the existing industry operations: It only requires enhancing decision-making tools by the stakeholders, and carefully-defined protocols for implementing their interactions.
1 Introduction
Utilities are currently rethinking their resource planning as the industry landscape is rapidly changing. Many new, relatively small-scale technologies request connection to the utility transmission/distribution (T/D) grids. They are generally referred to as the distributed energy resources (DERs) and could be any controllable small resources or users, or a combination of resources and users, known as prosumers [1]. At present, the DER resources are small controllable wind power plants, small hydro plants, inverter controlled solar photovoltaics (PVs) and batteries. The DER prosumers are industrial, commercial and residential end-users with controlled HVACs, electric water heaters, and pumps, and also clusters of electric vehicles (EVs). The challenges created by the deployment of DERs are multi-fold and include uncertainty in their power generation/consumption patterns. On the other hand, the controllable DERs have the potential to help with grid services, in particular with fast responses to uncertain power imbalances, and to enabling feasible power delivery. Perhaps the most immediate challenge is that utilities need to post the ‘dynamic hosting capacity’ (DHC) available in their system regarding the number of DERs that can connect to the T/D system without significant grid enhancements [2]. Common to all existing literature is a lack of decision-making tools for both planning and operations, which have the potential of increasing the hosting capacity of the grid. In this study, we stress the design of computer application for decision-making offers new opportunities to enhance their operations and planning in novel ways and to become proactive enablers of integrating DERs at value. Moreover, the formulations in this study apply to general T/D grids, and not only to radial distribution grids. Much needs to be done for this to become a reality. While this study only considers innovation required to support DERs in operations planning, its results can be used for post-processing when assessing different candidate investments. This need for data-enabled innovation in support of decision-making is recognised at present, and utilities are beginning to deploy dynamic energy resource management system (DERMS), which are expected to facilitate effective integration of DERs. This study identifies the fundamental needs for new principles when designing DERMS computer platforms; once the DERMS architecture is conceived, it becomes possible to deploy data-enabled computer applications in support of decision-making based on advanced grid analytics tools [3, 4]. To move forward and innovate, utilities must understand the need for basic data-enabled decision-making tools when operating and planning the system on their financial outcomes and operational feasibility. This study is a step in this direction.
The basic idea in this study is that the utilities need data-enabled decision-making based on binding information exchange with stakeholders supporting well-defined contractual arrangements. These, in turn, can be implemented by (i) embedding data-enabled decision-making tools within all stakeholders; and, by (ii) establishing protocols for data-enabled information exchange with the grid owners and system operators. Computer platforms and decision tools for implementing such protocols form the basis for an effective DERMS. Modelling and decision-making analytics perceived as necessary is based on the general dynamic monitoring and decision systems (DyMoNDS) framework introduced some time ago in [5]; the framework is applied to define interactive protocols for DERMS. This design results in re-integrating the distributed decision-making, essential for enabling stakeholders' choice, with the system-level reliability and efficiency objectives interactively. It is described in this study how such DERMS design can support operations planning at value. It also supports reliability-related risk management at value, which, too, gets embedded and internalised into stakeholders' decision tools. While sources of risks in the changing industry are many, it is shown in this study how the reliability-related risks can be managed using advanced DERMS. We illustrate how this can be done and discuss some open questions.
This study offers two major contributions. It first assesses today's operations planning approaches for their ability to integrate new technologies, such as DERs. A centralised operations planning problem formulation is proposed first to be used for modelling decisions needed for reliable and efficient electricity services. The problem has both conventional controllable equipment and controllable DERs as components whose outputs need to be scheduled as system conditions change. Important for purposes of DERMS design is that the physical grid constraints, such as thermal, voltage and stability limits, and the component constraints, such as their rate of response and capacity, can significantly affect the reliability of electricity services as well as the cumulative operating efficiency. Because of this, the proposed formulation includes these constraints when assessing new candidate technologies. However, this centralised problem formulation does not lend itself well to managing uncertainties, and its implementation falls under the category of stochastic multi-temporal non-linear optimisation, whose computational complexity becomes quickly overwhelming [6]. As such, it is not possible to use it for online decision-making in large-scale T/D grids.
The second contribution of this study is a new distributed interactive operation planning problem formulation which is intended to overcome this fundamental complexity. It is explained how this formulation lends itself to the changing industry in several significant ways, in addition to its potential for being less complex to implement. Instead of either assuming deterministic load scenarios and/or certain bounds on uncertain variations around the deterministic projections, the distributed stakeholders themselves provide the ranges of their likely demand and generation variations. The stakeholders account for their specific technological constraints, and risk preferences, and set their own distributed performance sub-objectives when determining the ranges of power and their willingness to pay/sell. This stakeholders' willingness to participate in system-level electricity services can be obtained either by exchanging information with other stakeholders multi-laterally and/or by relying on information about projected electricity prices by the aggregators and system operators. A minimal interactive information exchange with the coordinating entities is described. For multi-lateral information exchanges see [7, 8].
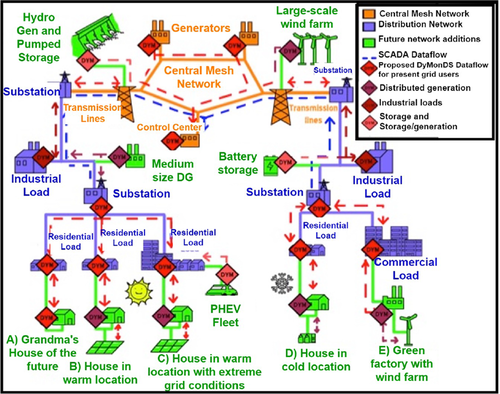
The study is organised as follows: In Section 2, the overall problem of hosting capacity in the emerging systems is summarised, which requires a data-based assessment of hosting capacity. This section summarises current methods and makes a case for enhancing the existing assessment methods. Fundamentally, the ability to integrate new resources without major T/D grid investments depend on both hardware deployments and on the way the equipment gets utilised in operations planning. Seen by the T/D grid owners and operators, it is much harder to operate and plan the grid when power injections, both supply and demand, are uncertain and often rapidly varying [2, 3]. There exists a real danger of doing investment planning for assumed scenarios, independent of how the equipment gets operated. To overcome this problem, in this section, the dependence of hosting capacity on DERMS computer applications are stressed. Shown in Fig. 1 is a sketch of a typical distribution feeder serving small customers equipped with different technologies. Using this illustration, we formalise the definition of the hosting capacity in Section 2 and describe limiting operating problems. In Section 2.1, we summarise current approaches to estimating hosting capacity and follow up with the possible new ways of assessing it in Section 2.2.
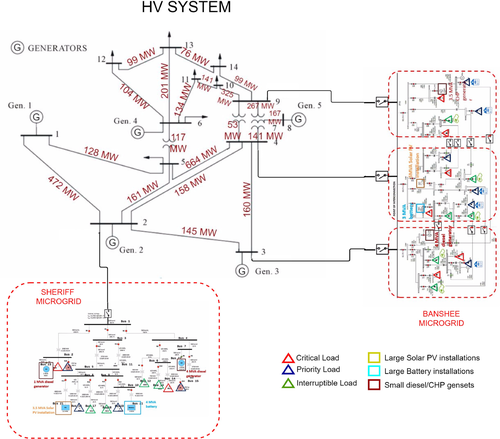
End-to-end HV–MV–LV system with various embedded DERs
This is followed by the newly proposed interactive DERMS framework formulations. In Section 3, a sufficiently granular operations planning problem formulation is posed to account for unique challenges and hidden benefits brought about when DERs are deployed. A taxonomy showing paper contributions is presented in the context of its relevance for enhancing hosting capacity in Table 1. This is illustrated on the system shown in Fig. 1. Here, the DyMonDS architecture describing how bulk power system (BPS), DSOs and DERs interact (See Fig. 2). First, in Section 4, the distributed decision-making by DERs is formulated and the cost functions they compute to abstract the inner complexities and the risk preferences of meeting comfort requirements is illustrated.
| No. | Contribution | Description |
|---|---|---|
| 1 | centralised operations planning method that includes reliability (1a)–(1l) | introduced new methods for assessing operations problems over a prolonged period of time while (i) integrating wind power plants and other generation at the transmission level; (ii) interacting with DSO's DERMS which are coordinating solar/storage/small generation units or responsive demand. (Fig. 1 represents such emerging system) |
| 2 | interactive protocols for DERs interacting with DERMS and/or multi-laterally with other neighbours in their radial distribution grid (2) | formulated a distributed model predictive control (MPC)-based scheme in making either of the coordination methods be feasible |
| 3 | interactive protocols for DERMS of DSOs (4a)–(4c), (5a)–(5c), (6a)–(6c) | formulated interactive models and proposed information exchange framework between DSOs to their DERs |
| 4 | interactive protocols for an end-to-end reliable system (7a)–(7c) | formulated interactive models and information exchange framework between the TSOs and DSOs and its applicability to when (i) TSO is responsible for reliability (ii) DSO is responsible for reliability within the respective regions of governance |
| 5 | generalised interactive protocols for enhancing dynamic hosting capacity (DHC) of an end-to-end system (Fig. 2) | general protocols were deduced that would most significantly depend on the (i) local embedded intelligence that could make use of distributed MPC schemes to send information from lower layers (ii) absility of ACOPF solver to enhance dynamic hosting capacity by optimising controllable T/D equipment setting and those of participating stakeholders |
| 6 | proof-of-concept of interactive protocols for an end-to-end reliable system (Sections 5.3, 6.2, 7.1) | contributions 2–5 are supported with numerical examples using the system in Fig. 1 with standard IEEE 14 bus system acting as a transmission grid that connects to two real world microgrid distribution feeders |
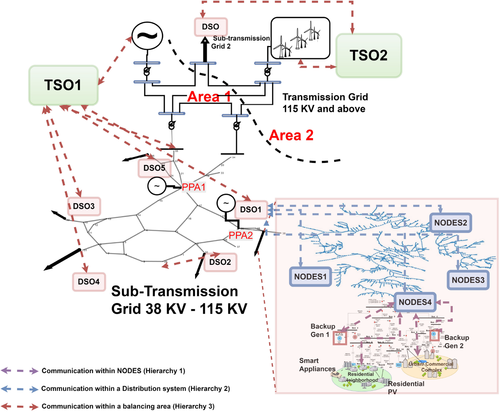
Architecture showing how BPS, DSOs and DERs interact
Next in Section 5, we describe the proposed DERMS architecture, which requires minimal information exchange for both operating and planning for enhanced hosting capacity at value. This architecture sets the basis for the proposed principles and protocols for effectively integrating different stakeholders' decisions and aligning them with the system-level societal objectives. Here, the two basic functionalities of DERMS for DSOs: communicating aggregate preference of DERs to DSOs; and that of finding optimal adjustments of controlled DERs, given estimations of inflexible demand predictions and the risk preference are formulated. With the inter-temporal complexities handled by DERs themselves, the static coordination is performed by higher layers using advanced ACOPF software, that is described in the Appendix. The potential benefits of using such voltage optimisation at each of the coordination layers for enhanced power delivery are also shown through simulations in Section 5.3, 6.2 and 7.1.
In Section 6, the reliable end-to-end operations planning protocols are explained wherein the DERMS of DSO-computed aggregate cost functions are all coordinated by the transmission system operator at the BPS level, thereby making a case for smart distribution grid, which provides service to the system as a whole and is rewarded at value. While the local risk preferences are handled by the DERs themselves, the approach to handling the equipment outages-related risks are addressed through an improved dispatch strategy that can be embedded in the DERMS computer platform as explained in Section 7. More precisely, it is described how DERMS can enable interactive operations planning by all stakeholders at value, including risk management related to reliability and ramp rates. In closing Section 8, the proposed approach is summarised and some open questions and recommended next steps are discussed.
2 Hosting capacity in distribution systems
The term dynamic hosting capacity (DHC) has recently been used to signify the number of DERs that the electric distribution system can reliably accommodate without significant grid upgrades [9–11]. On conducting a thorough hosting capacity analysis, utilities consider voltage/power quality constraints, thermal constraints, protection limits, safety, and overall reliability to arrive at a capacity (kW, MW) of new generation or load which can be accommodated at a specific location on a distribution circuit [2–4]. Hosting capacity depends heavily on location. It is unique to specific feeders and is time-varying. Given that customer needs are always changing, a hosting capacity analysis conducted today may yield different results than an analysis prepared five years from now. In general, carefully crafted hosting capacity analysis can give DER developers insight into where on the grid DERs can interconnect and potentially, on a forecast basis, where utility upgrades may be needed in anticipation of deploying more DERs. Recently it has been recognised by the industry, including regulators, that the results of hosting capacity analysis depend heavily on particular analysis methods used. In what follows, we briefly summarise these methods in the context of their ability to enable the integration of DERs. We then propose that relatively straightforward decision-making methods can be used to enhance and make the process of hosting capacity assessment (HCA) more efficient. This is followed by the major observation that utility alone cannot assess hosting capacity without proactive participation by all stakeholders. Most of this study is intended to introduce physically sound principles for designing DERMS as the enabler of interactive hosting capacity estimation, implementation and valuation.
2.1 Assessing hosting capacity today
Today's HCA methods only analyse but do not make any decisions. As such, they are time-consuming and sensitive to the type of operating constraints included, and, notably, to the study cases selected. HCA methods such as streamlined method, iterative method, and stochastic method all fail to quickly answer the following question: Given the current grid and set of candidate DERs, determine the limiting operating constraints to deploying these into the existing grid without requiring grid upgrades. Instead, the methods model hypothetical DER cases and scenarios and attempt to identify the most frequent violations by performing trial-and-error analysis. For example, in the case of the iterative method as referred to in [11], the approach is to increase amounts of DERs iteratively at each node, one at the time, and run power flow analysis. The process continues until some thermal or voltage limit is reached. Notably, different iteration will result in different hosting capacity. The stochastic method creates a set of Monte Carlo scenarios around the likely loading conditions and, again, utilises power flow analysis. Based on these analysis methods, utilities post their hosting capacity at the frequencies determined by the regulatory rules in their area, perhaps once a month. These methods do not differentiate and do not asses the potential value of the computed hosting capacity to the end-user or the distribution grid owners. It is important to note that all analysis currently used fail to assess any potential dynamic instabilities which might be created by the fast varying inverter control of solar PVs or by inadequate demand response [12].
2.2 New methods for assessing hosting capacity
Assessing hosting capacity can be improved in several different ways. To start with, instead of utilising hypothetical scenarios, it is possible to utilise data from smart meters to obtain good statistical models of end-users' consumption. If the utility already offers time-of-use (ToU) rates, it becomes possible to learn from smart meter data how customers' energy use differs from their historical usage. This collected data begins to reveal the value of electricity to different end-users. Second, it is possible to find the most likely thermal and voltage limits for whichever scenario of interest using optimisation tools, such as AC optimal power flow (AC OPF) rather than performing trial-and-error power flow analysis until all constraints are observed. We illustrate later in this study that the optimisation software can also output the Lagrangian coefficients as a byproduct of optimising the amount of DER power in any given scenario to indicate the sensitivity of cost function optimised with respect to the respective binding constraints. This information becomes critically important for planning purposes for the smart distribution grid to pro-actively improve the grid and provide value to the DERs and other end users. However, such information is hard to obtain when performing trial-and-error scenario simulations until some constraint becomes binding. As a result, replacing analysis software with optimisation tools can go a very long way to both finding the most critical constraints to candidate deployments, and to indicate the trade-off cost between upgrading the grid, on one side, and limiting the deployment of DERs, on the other. Notably, given historic end-users data and performing optimisation for limiting hosting capacity, distribution grid owners could establish ToU tariffs that reflect the value of service to end-users and, therefore, give incentives to the end-users to stay with their current providers. An example illustration of the hosting capacity analysis and improvement is described next using the two distribution feeders, shown in Fig. 1.
2.3 Dependence of hosting capacity on methods used - critical role of using AC OPF
Consider the two small distribution systems shown in Fig. 1 going downstream of buses 2 and buses 3, 4 and 9, respectively. These small distribution grids are capable of operating by themselves and are referred to as Sheriff and Banshee grids [13]. These systems have their loads categorised as interruptible, priority and critical loads. The grid data and load distribution can be found in [13, 14]. Using this grid, we first show an example of how crucial is the ACOPF-based clearing strategy used by the DERMS to coordinate DERs within the Sheriff and Banshee grids.
Shown in Fig. 3 are typical findings regarding the ability of the Sheriff microgrid, shown in Fig. 1, to support 3.5 MVA solar PV installation during the period for which load and radiance deviations are considered [15]. Similar findings are tabulated for the Banshee distribution feeder shown in Fig. 1 to support 5 MVA solar PV installation for different configurations. Notice that each feeder in the Banshee distribution grid in Fig. 1 has sufficient power to supply its own load when the grid is connected to the utility. There are seven normally open switches (NoSs) that cut off the direct connection between the three feeders of Banshee microgrid from one another during normal operations. These switches are closed when the three other normally closed switches (NcSs) connecting these feeders to the transmission grid get disconnected due to some unforeseen event. Multiple scenarios with different grid configurations for different loading scenarios were tested for the control actions taken. The scenarios outlined in Fig. 3 are a small subset of the challenging ones identified, and it shows the fundamental dependence of the grid ability to operate with DERs on both NoS and NcS grid configurations.
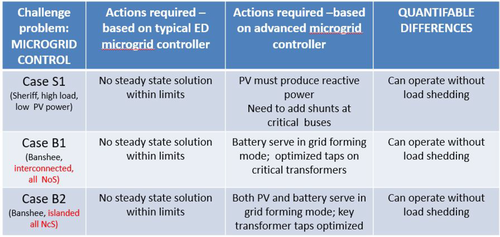
Static snapshots results obtained for the challenge problems proposed in [15]
Case S1 is the case representing the scenario of high load, and low PV power, corresponding to time 60 in Figs. 4 and 5. Currently used power flow analysis tool shows that it is not possible to find a power flow solution. Instead, the use of an AC OPF for the same scenario indicates that the most critical limitations to operating this solar PV at times of low radiance and high load is the lack of reactive power support. The output from such optimisation furthermore implies that it is necessary for solar PV to produce reactive power, or support its voltage, in addition to sending real power into the grid. It is also found where there may be critical shunts that the distribution grid may need to install to support the integration of this solar PV. If this is done, the grid would have sufficient hosting capacity to operate without having to shed any load.
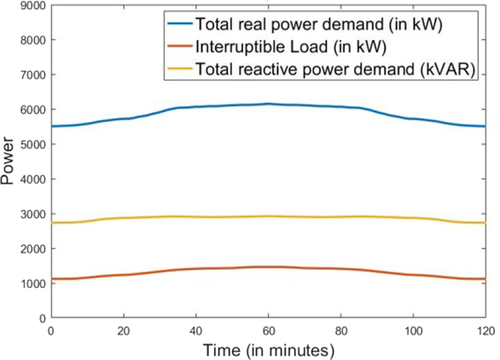
Typical total load patterns of a distribution feeder [13]
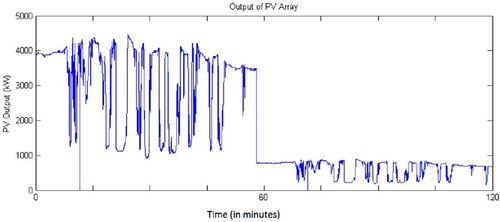
Typical residential solar power injections into the grid [13]
Similarly, Cases B1 and B2 show dependence of the distribution grid on its reconfiguration to support 5MVAs of solar PV. In Case B1, both real and reactive power imbalances are compensated by the power which comes from the higher voltage grid and the NoS are open. Despite power delivered from a higher voltage grid, reactive power is deficient if the battery only provides real power and does not maintain voltage in grid forming mode. The AC OPF identifies these deficiencies and could be used as an advisory tool to the operator and planner. At the same time currently used power flow analysis does not give a solution, the software crashes. The Case B2 is even more interesting, and hard for the distribution grid operator to resolve without AC OPF. In the case when the grid is disconnected from the higher voltage utility, the three feeders attempt to share power by closing switches. However, the power flow analysis shows in this case that there is no solution, implying that the grid cannot support 5 MVA solar PV in this case. When the optimisation tool such as an AC OPF is used, the result indicates that both solar PV and the battery need to control their voltages and that the controllable taps on a few transformers must be optimised. When this is done, the same grid can have an increased hosting capacity.
Finally, highly varying DERs are creating much more dynamic changes in power injections into the distribution grid, and, unless they have the right automation embedded, can create ‘hidden’ failures as protective relays open during such instabilities. Shown in Fig. 6 is the overall conclusion from what is achievable using state-of-the-art proportional controllers versus more advanced non-linear controllers for each of the operating conditions considered in the challenge problems for static analysis. Utilities should thus also have modelling tools to assess whether such an event would occur, and, also, could engage in the business of deploying smarter automation for DERs at value.
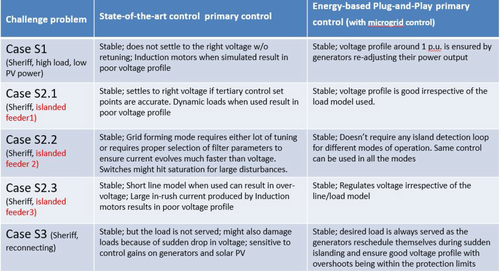
Dynamic simulation results obtained for the challenge problems proposed in [15]
Up to now, we have only considered the dependence of hosting capacity on the assessment software tools for given scenarios of interest. We next observe that the selection of scenarios and test cases greatly affects the outcomes [11]. While this observation should not come as a surprise to anyone, it is important consider it when assessing the hosting capacity of future T/D grids. DERs are qualitatively different from the inflexible historic load because of their high variability. As such, they could create major operating problems and limit hosting capacity only during some extreme conditions as illustrated above, while during most of the time they can be utilised. However, when made controllable, they can also respond quickly to power imbalances and also control voltage. Because of this, it is fundamentally incorrect to assess hosting capacity by selecting what one may think of as the worst-case scenario or by performing stochastic methods which arbitrarily create Monte Carlo scenarios around the historic load profiles. Instead, it becomes necessary to establish an interactive information exchange and protocols for operations planning. In the next section, we first pose a benchmark problem to pursue this notion of aiding the grid. Then in order in order to integrate decision-making by the DERs and other stakeholders, we propose to have an interactive approach to providing reliable electricity services, thereby increasing the hosting capacity of each of the distribution grids.
3 Centralised operations planning
The effects of deploying and using DERs for grid services on system-level performance can be modelled and assessed fundamentally the same way as the effect of conventional generation is modelled and assessed. The uncontrolled DERs are simply modelled as negative loads. Management of DERs requires generalisations of current approaches to include both DERs and conventional generation. In the past typically only the effects of conventional generation on high-voltage BPS shown in Fig. 1 are assessed for operations planning. BPS is modelled and analysed for various scenarios and the effects of large distribution grids and its end users are modelled as uncontrolled aggregate loads. At present, the BPS SCADA only reaches to the substations serving distribution grids conventional generation. The distribution grid control and protection are pre-programmed under the assumption that power flows uni-directionally to the end users. However, this underlying architecture is substantially changing as DERs are embedded into all levels of the electric power grids.
In the past, an ideal benchmark formulation of the DER management (operations and planning) only considered the objectives of balancing supply according to societal optimisation objectives (these vary, depending on governance objectives; used to be just fuel cost, in the future, they might include the environmental objectives as well). Much of large scale generation operations planning is based on the coarse formulation in which decision variables are the conventional generation schedules, while the rest of the resources are treated as load uncertainties, or of negligible effects if controlled.
 contingencies. In what follows we first formulate operations planning for normal conditions, and explain how maintenance and reliability enter the formulation. Notably, uncontrolled deviations in DER power outputs can also be taken into consideration by scheduling so that the system is operationally feasible within the projected bounds of deviation. Let the sample number corresponding to operations be denoted as k. Let us consider an end-to-end power system network shown in Fig. 1 including the area governed by both TSO and DSO using
  where the nodes of the network
  and edges are denoted by pair of nodes
  . Some of these nodes have conventional generation
  , controllable DERs
  and inflexible demand
  incident on node n. Generators and DERs at any node in the network are all grouped in the sets
  and
and  , respectively. To accommodate the DERs, one has to consider the cost of operation and their physical limitations as well. Let us thus denote
  for the conventional generation and
  for the DER power injections. Then, the benchmark performance cost is generally defined as the cumulative fuel cost over all stakeholders (in the past large generation only) as shown in (1a). These costs are assumed to be known and deterministic, as everything else is in the theoretical benchmarking.
 (1a)
(1a) (1b)
(1b) (1c)
(1c) (1d)
(1d) (1e)
(1e) (1f)
(1f) (1g)
(1g) (1h)
(1h) (1i)
(1i) (1j)
(1j) (1k)
(1k) (1l)
(1l) and they also have certain capacity limits
  as modelled in (1b) and (1c), respectively. On the other hand, the DER internal constraints are very much technology-dependent and are abstracted using the function
  instead. For instance, if this DER were a small diesel generator, this would take the form similar to that of ramp-rate constraint modelled for conventional generator. If on the other hand, it were a controlled EV, it would have to be modelled using its internal states
  , such as the state of charge and the power injection
  which are both constrained by certain physical limits.
Furthermore, the network constraints are non-linear non-convex constraints shown in (1g)–(1l). Here  and
and  represent the voltage phasor magnitude and the angle at node n. For assuring the quality of service, the voltage is supposed to be within the limits
  and
and  . The line flows denoted by
  are functions of these quantities which need to be within the thermal constraints of the wires. The net injection at each of the nodes due to the incident generation, DERs and the load result in these flows where n corresponds to the node n and j corresponds to the other nodes connected to node
  . The load predictions at respective nodes
  are assumed to be available.
Given the time-coupling and the non-convexity of the network constraints and possible non-linearity of DER physical characteristics  , this problem becomes infinitely complex to solve in order to plan for the entire day while considering the optimal operation schedules of the technologies. Further, in order to ensure reliable operation, each quantity above needs to be appended with a superscript s to denote scenario where
  represents normal operations scenario while any other s denotes the possible contingency scenario of interest that is to be planned for. Typical contingency scenarios under consideration by the operators are
  indicating that the utility prepares for any unforeseen single or two simultaneous equipment outages. This exacerbates the model complexity further and makes it intractable to be solved by the operator.
According to the Western Electricity Coordinating Council, reliable operation of grid entails planning for adequate generation capacity availability at all times to serve the following functionalities: [16] (i) supply requirements for load variations; (ii) replace generating capacity and energy due to forced outages or generation and/or transmission equipment; (iii) meet on-demand obligations; (iv) replace the energy lost due to curtailment of interruptible obligations. The most common approach used by the operator to satisfy reliability criteria is to perform trial-and-error-based methods until pre-defined convergence criteria is met. A simplified flowchart of such an approach is shown in Fig. 7. For more details on this, see [17]. This entails solving the cost minimisation algorithm subject to approximate DC power flow constraints and then checking the schedules for any possible reliability constraints violations. Upon violation, the proxy thermal line flow constraints are constructed to solve the DCOPF-based optimisation once again and the loop continues until convergence. Notice that this is trial-and-error-based analysis method having no reproducibility of schedules and taking a prolonged time to solve.
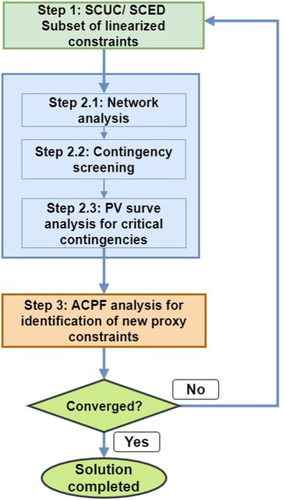
It thus becomes quintessential to come up with simplifications that could let one obtain a reproducible solution. Another issue with respect to solving this problem is that the DER characteristics typically are not available, even if there exists a hypothetical solver that can solve this complex problem posed in (1a)–(1l). In order to address this problem, in this study, we propose one framework for exchanging necessary interactive information exchange. We refer to this framework as the DyMoNDS framework [5, 19, 20]. This is effectively the next generation SCADA that supports minimal information exchange required to integrate diverse stakeholders with often conflicting sub-objectives so that they are aligned with the objectives of an end-to-end system.
3.1 Towards DyMonDS-based interactive protocols for provision of reliable electricity services
Shown in Fig. 8 is a sketch of DyMonDS framework, which we introduced some time ago. We have demonstrated its usage in enabling electricity services provision with 100% renewable resources in the Azores Islands, Portugal both efficient and long-term cost-effective [21]. This framework can be thought of as an end-to-end multi-layered electric power grid cyber-physical architecture which enables information exchange between different layers according to model-based protocols. DERMS is then a particular case of DyMonDS architecture which could have several layers itself as will be described in Section 5. This architecture forms the basis for the pro-active participation of all stakeholders. The lower-layers make decisions specific to their own technologies, risk preferences and sub-objectives and create what amounts to bid curves given to the higher layer aggregating entities. Very small end-users could also exchange bids horizontally with the neighbours in a peer-to-peer manner. They jointly create aggregate bids into higher layer aggregators, which, in turn, provide bids to the higher level coordinating entities such as (independent) system operators or whole sale markets [8, 22, 23]. The bids are formed by embedding intelligence (local DyMonDS is shown in Fig. 8 and the higher level aggregators and coordinating entities clear these bids according to their own performance sub-objectives. The performance of higher level aggregators is generally monitored by the regulators and/or market monitoring entities to ensure that they do not exhibit market power. A conceptual diagram of DyMonDS as a flowchart is shown in Fig. 9, for a better understanding of the flow of the information.
DyMonDS framework [5]
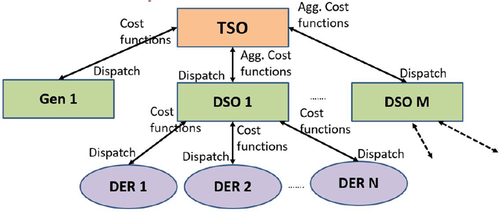
Conceptual diagram of multi-layering showing the information exchanged
In this study, we propose a layered approach to the provision of electricity service while allowing for increased hosting capacity of each of the distribution feeders. Table 2 summarises the contributions of this study while also providing the order in which the proposed concepts will be explained ultimately leading us to the original goal of attaining reliable and efficient electricity service. More precisely, we propose a multi-layered interactive scheme whereby interactive protocols get embedded at each hierarchical level, so that the lower layer entities utilise MPC schemes to ascertain their own requirements over multiple time periods subject to their own risk preferences and communicate a cost function for use by the higher layer coordinators. A conceptual simplified equivalent flowchart corresponding to that of the one in Fig. 2 is shown in Fig. 9. To better understand this entire process, we explain each of the layers' sub-objectives at different hierarchical levels according to the order in the taxonomy Table 1. Furthermore, this is all explained for normal operating conditions i.e. only for  for simplicity. We will then provide a brief discussion of how reliability can be assured ultimately by utilising these interactive schemes.
| Gen./DER i | Maximum capacity | Linear operations cost coeff. | Quadratic operations cost coeff. | Ramp rate, |
|---|---|---|---|---|
 , MW , MW |
 , $/MWh , $/MWh |
 , $/MWh2 , $/MWh2 |
 |
|
| 1 | 352 | 20 | 0.01 | 30 |
| 3 | 100 | 40 | 0.01 | 50 |
| 6 | 100 | 40 | 0.01 | 50 |
| 8 | 100 | 40 | 0.01 | 50 |
4 Distributed interactive risk management in operations
Currently, ensuring reliable operations is solely the responsibility of the local electricity provider. To do so, it is required that the utility (independent) system operator should take the responsibility of estimating bounds on uncertainties and operate so that for what is assessed to be the worst-case scenario, full load is served unconditionally. So far (I)SO has been able to project bounds on system demand, and has implemented software necessary to screen equipment failures which would lead to lack of power flow solution or dynamic instabilities. This has been primarily done by running contingency analysis using approximate versions of power flow software. Either decoupled real power load flow and/or linearised sensitivity analysis are being done to assess the contingencies which would around predicted demand reach thermal limits; the result of this contingency screening is typically a list of ‘critical contingencies’ [24]. Ensuring that reactive power balances and voltages remain within the acceptable limits is typically tested only for these critical contingencies by running AC power flow analyses. In case there is a problem with balancing reactive power within the given voltage limits, I(SO) adjusts real power line flow limits according to his/her knowledge of system responses and/or based on earlier off-line studies. This approach is practiced by the (I)SOs operating EHV grid who estimate injections into lower-voltage parts of the interconnected grids, distribution grids, in particular. At present, there is significant effort to extend this approach to lower voltage levels and this would be one of the basic DERMS functions.
However, the DSOs are likely to experience qualitatively new challenge unless they interactively exchange information with the lower level load-serving entities (LSEs). LSEs themselves should either exchange in operations information with their end users or have a priori knowledge regarding end users' willingness to respond to changes in operating conditions. The main objective is to relieve the DSO from having to guess end users' response and to, instead, account for this knowledge when scheduling all resources to supply the utility demand. DERMS architecture proposed in this study is fundamentally based on this interactive information exchange between different layers of an interconnected system. This exchange is needed to support DER participation in particular; this must be at value, otherwise, they will not participate. Perhaps the most relevant feature of the proposed approach is that the risk of various uncertainties gets distributed over all stakeholders and over different time horizons. Even the most rational stakeholders differ significantly regarding their risk preferences. Given regulatory rules about which stakeholders should be responsible for managing uncertainties and the related risk, the outcomes can be very different. Moreover, it is practically impossible for the system operators to manage multi-temporal risks while enabling reliable power delivery via a highly non-linear electric power grid. The main idea of DyMonDS-enabled DERMS is to require stakeholders to create simple convex bids while internalising complexities in their own specific models, to respond to electricity price and consumer preferences.
4.1 MPC-based operations planning by the DERs
In what follows we briefly summarise the process supporting such interactive decision-making. Depending on the rules regarding risk management responsibilities, different versions of DyMonDS can be implemented. As a general rule, it is probably most effective to embed temporal uncertainties and risk preferences into decision-making software by the end users and/or LSEs (embedded local DyMonDS, Fig. 8 in the study). Our group has long promoted this approach, and variations of such solutions can be found for: (i) deterministic adaptive energy load management [25]; (ii) for deterministic management of energy and reserve load management [26]; and even for stochastic management of EVs participating in regulation reserves [27]. We formulate next the basic decision-making by the agents participating in DyMonDS, creating their bids as follows [26].
Given the anticipated stratum of energy prices  and reserve prices
 each DER solves the following problem to create its own bid functions for average energy consumption
  over
over  interval and provisions of reserves
  through demand adjustment (or generation increment) at any time instant
  by minimising its cost of generation and maximising the revenues from selling energy and reserves. At any time the look-ahead cost function is minimised to take into consideration the effect of future prices to be able to take advantage of possibly higher gains in the future time intervals.
 (2a)
(2a) (2b)
(2b) (2c)
(2c) (2d)
(2d) (2e)
(2e) and effective consumption lies in the range
  .
.4.2 Proof-of-concept illustrations of bid functions created (contribution 2)
 and
and  , the agent (responsive demand, as an example) optimises its expected profit and creates two bid functions shown in Fig. 10 for individual electric water heater as an example. Each of the energy and reserve bids are computed by solving the problem posed in (2a)–(2e) for slight perturbation in energy and reserve prices, respectively, to obtain demand points as shown by little circles in Fig. 10. These points are interpolated to obtain the sensitivity of the bid or willingness to pay with respect to the energy in the case of energy bid. Linear interpolation is utilised to empirically obtain the value of slope
  and intercept
  , both of which vary with time. The sensitivity of the bid function can be written as shown in Fig. 10. The bid function for energy is then obtained by integration of the above sensitivity with respect to
  resulting in the expression
 (3)
(3) and
and  as shown in Fig. 10. Similarly, the reserve supply bids can be constructed.
Energy and reserve bids of a responsive water heater
Next, a group of these agents which when coordinated by an aggregator with negligible grid affects produces similar aggregate bid functions for energy and reserves as shown in Fig. 11. If the grid effects are non-negligible, the approach described in the next section is to be taken to produce aggregate bid function to communicate to the higher layer.

Energy and reserve bids of an aggregate of electric water heaters
Creating and exchanging bids is a qualitatively different approach from the distributed point-by-point iterative information exchange [16, 28]. This method of functional bids utilisation reduces the need for excessive communications as the near-optimal solution can be achieved in just a single iteration.
These bid functions are sent to the DSO who ideally solves AC OPF to optimise both real power schedules and voltage settings within the acceptable limits as in (4a)–(4c). This will be discussed in detail in the next section. Apart from these bids being coordinated, they can also be multi-laterally cleared through peer–peer information exchange where each DER can communicate with its neighbours until all of the DERs satisfy certain criteria. This approach has been proved to converge for radial distribution feeders. (See [8] for details.) Creating bids by the end users by solving Eqn. (2a)–(2e) can be further generalised to account for risk preferences and even environmental preferences.
5 Interactive protocols for DERMS
The basic objective of future DERMS is to supply power to its users reliably and at as least cost as possible. This task is quite complicated when serving many DERs willing to participate in supply–demand balancing. This is particularly challenging because of various uncertainty-related risks. These are very diverse and include potentially significant effects of controllable demand, intermittent hard-to-predict renewable power and equipment failures. As a result, net system demand is much more varying in hard-to-predict ways than in the past. Future DERMS will also be required to coordinate its operations with the higher-level system operators, and this also creates uncertainties.
A sketch of DERMS architecture for the Sheriff distribution grid shown in Fig. 1 is detailed in Fig. 12. The aggregation of DERs into portfolios are non-unique. Also, the aggregation of small end users into their LSEs is shaped by the end users themselves, for example, as the end users select their provider, which is not necessarily distribution grid owner. These architectures, although non-unique, must follow common protocols in order for the integration of these highly diverse groups of stakeholders to align with system level societal objectives jointly. It is most typical that the LSEs only aggregate supply and demand of their members without observing distribution grid constraints. It is also possible to have LSEs serve end users subject to these constraints in multi-lateral ways. Depending on the actual architecture resulting from such aggregation, the hosting capacity by the distribution grid itself can vary.
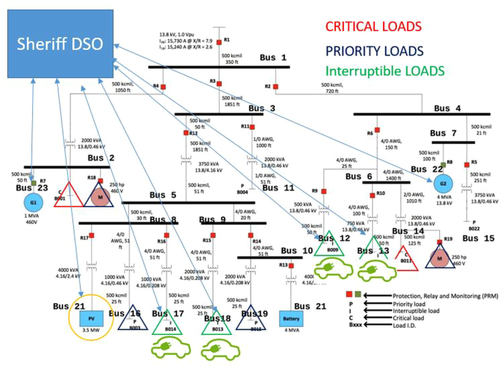
DERMS architecture based on DyMonDS framework embedded into Sheriff grid
DERMS for DSOs involves two major functionalities: (i) coordination of its DERs and (ii) aggregation of its DERs. A conceptual flow diagram representation of the DSO model while fulfilling each of the two objectives is shown in Fig. 13. While aggregating the bids to submit to its higher layer, the flow is directed into the transmission grid. At the same time, when it assumes the responsibility of coordinating its DERs, it assumes the direction convention of a utility generator capable of injecting finite amount of power as dictated by the TSO with a sign difference. From the figure, it is clear that both the functionality can be carried out by modelling a fictitious generator at the point of interconnection with a specific assumed direction of flow. For either of the two functionalities, the DERMS of DSO is supposed to solve two problem formulations to be described in Eqn. (4a)–(4c) for coordination of its DERs and in Eqn. (5a)–(5c) for producing aggregate bids on behalf of its DERs given certain anticipated prices seen at the point of interconnection upstream of the grid. Each of these is described in some detail in the rest of the section.
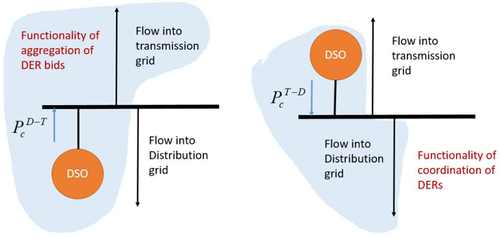
DSO modelled as a fictitious generator with designated flow direction for each of its DERMS objectives
5.1 Coordination of DERs by DERMS of DSO
When it comes to managing the DERs, two approaches can be used by the DERMS of DSO. This is non-unique and depends on the characteristics of the DERs within the DSP's jurisdiction. For example, if there are less number of controlled units within the distribution system, the centralised management approach described below can be taken. Otherwise, the distributed management is performed wherein the DSO waits to receive the bids from the DERs and then solves the distributed management problem described later in the section.
5.1.1 Centralised management by DERMS
The problem of balancing supply and uncertain demand is formulated next. It is possible to define the set of generators and DERs within the jurisdiction of a DSO. Let them be denoted as  and
and  , respectively. Similarly, let the part of the system under governance of the DSO be denoted as
  . If this DSO falls within certain TSO, we then have
  and similarly for the edges. This problem requires the complete knowledge of all of its DERs. Thus this problem formulation is exactly analogous to that of (1a)–(1l) where the sets
  are replaced by
  . The only difference between the two formulations is that the power balance constraint in (1j) written at the point of interconnection needs to make use of the dispatch value
  given by the TSO. Also, this formulation assumes that the aggregate inflexible demand at each of the load nodes as well is predictable. Often bounds of the variation around the predictable component are made use of, to solve for co-optimisation of energy and reserves. For details on this, see [26],
This formulation lends itself to the direct load and generation control. In other words, DERMS decides unilaterally which loads to adjust and sends direct requests to the end users. At present this is only done during shortages, but to enable efficient reliance of controllable demand it is necessary also to manage controllable resources for efficiency during normal operations. When all constraints are included, co-optimisation of both energy and reserves becomes difficult to solve, given the number of end users in a typical distribution grid. The solutions are generally non-unique, depending on the protocols concerning responsibilities for providing reserve by different levels (DERs, DERMS, ISO) [26]. It has been well-documented that high penetration of DERs, solar PVs in particular, leads to voltage violations [29, 30]. This calls for optimising voltage dispatch as resources are dispatched for energy and reserves. Solving the above optimisation problem in a centralised way so that multi-temporal model predictive optimisation is done subject to non-linear load flow constraints creates a definitive computational challenge. This is one more reason for considering alternative architectures for DERMS. At present, there is no SCADA which would support such extensive direct load control, and there is no software to manage a high number of end users reliably and efficiently. As an alternative, we propose DyMonDS-based DERMS architecture for managing risks in a distributed way by different stakeholders and over multiple future time horizons. This is described next.
5.1.2 Distributed management of DERs by DERMS of DSO
 considering their long-term local performance objectives as described in Section 4 and assuming that the TSO has provided the dispatch command
  at all nodes c in the set of point of interconnection nodes, the problem formulation for coordination of DERs by DERMS of DSO is
 (4a)
(4a) (4b)
(4b) (4c)
(4c) is computed by the TSO and while the DERMS within DSO coordinates its DERs to supply
  based on the needs of its DERs, it ensures the two quantities are the same and it meets contractual commitments by modelling this equality constraint. Often, if it is not possible to meet these constraints possibly because of the wrong price estimated and wring bid function computations, the DSO can maintain storage technologies to offset the difference. It can also interrupt the controllable demand if needed as well, to meet the contractual commitments.
5.2 Aggregation of DERs by the DERMS of DSOs
 (5a)
(5a) (5b)
(5b) (5c)
(5c) to obtain the power consumption at of the fictitious generator placed the node
  . This quantity which when interpolated with price perturbations results in a marginal bid function of linear form the same way as was computed in Section 4 for the DERs by solving (2a)–(2e). This marginal bid is analytically integrated to obtain the quadratic curve of interest. Here, the bid gets created only for the first time instant by perturbing just
  but takes into consideration the future operating intervals cost and the constraints to lower the future risks of changes in operating conditions.
 (6a)
(6a) (6b)
(6b) (6c)
(6c) can be given to ensure there is always enough amount of energy available.
  is a pre-specified risk margin that the DERMS within DSO may utilise because of the unpredictability of the inflexible demand and/or if the DER bids can not be trusted. This choice is very much dependent on how risk-averse the DSO is.
5.3 Proof-of-concept illustrations of operations planning within DERMS of sheriff grid DSO (contribution 3)
In this example, we consider the Sheriff grid comprising two conventional gensets, with three neighbourhood aggregators coordinating several IOT (Internet of Things) devices which are all HVAC units. There is also a large solar PV installation producing uncontrolled power injections into the grid. In addition to the hierarchy of TSO and DSO, we consider another layer of hierarchy to aggregate multiple controllable HVAC devices. The objective of this study is to compare the results obtained by centralised static clearing of the controllable units for variations in load and solar PV injections as shown in Figs. 4 and 5, respectively, and the results obtained by embedding interactive protocols enabled by DERMS of DSO over three hours with a timestep of  -minutes are used for the clearing while being connected to the transmission grid (IEEE 14-bus system) at bus 2.
First, the problem in (2a)–(2e) is used by generators and HVAC devices to produce cost functions similar to the ones in Fig. 10. The ones of HVACs are aggregated by another layer of hierarchy to produce three aggregate HVAC cost functions similar to the ones in Fig. 11. Next, the DERMS of Sheriff grid DSO collects these aggregate bids and generator bids; then uses the model in (6a)–(6c) to create an aggregate Sheriff grid cost function that gets submitted to the TSO of the IEEE 14 bus system. From Sheriff grid perspective, the utility can be represented by a utility generator at point of interconnection which generates the dispatched amount of power by the TSO and distributes them among the load devices within Sheriff grid by solving the problem in (4a)–(4c).
Now, we compare this method of interactive protocols enabled by DERMS of DSO to that when DERMS of DS solves Sheriff grid management problem in a centralised way. It was shown that the centralised approach results in increased utility generation and sudden ramping up and down of expensive generation, while interactive protocols with DERMS of DSOs interacting with MPC-based bids created by DERs and conventional generation units result in increased local resource utilisation with smoother variations in generation schedules shown in Figs. 14 and 15. Also, marginal surplus resulting from both thermal and voltage congestion was at most time instants close to zero in DyMonDS interactive approach. Lower marginal surplus indicates that the distribution grid is better being utilised, which indicates that there is no need for any grid reinforcements to accommodate Sheriff grid DERs if the energy management is done better. Due to space limitation, we omit discussion regarding block-chain support for cyber-secure demand management of the neighbourhood users, for details see [31].
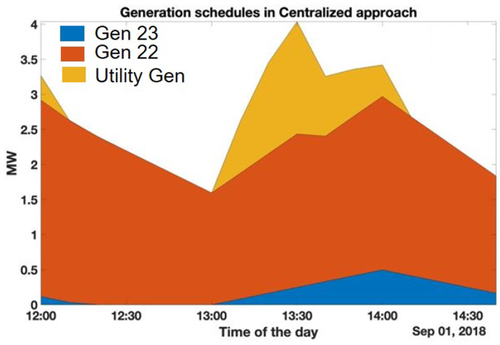
Generation schedules obtained through centralised static dispatch
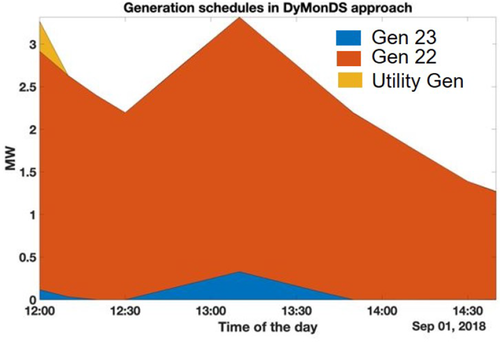
Generation schedules obtained through the distributed MPC-based clearing
6 Interactive protocols for end-to-end reliable services
For the assumed three layers of hierarchy, let the TSO's jurisdiction area comprise of the graph  , where
  and
and  . Let the DSOs (generators) compute their cost/bid functions and send them to the TSO. Let these cost functions be denoted as
  where
where  represents the set of DSOs coordinated by the TSO. The way this bid function is computed is elaborated upon in Sections 4 and 5. This functions comprises of the price elasticities
  for present time instant augmented with time-varying limits on the grid power injections
  The centralised problem in (1a)–(1l) can now be re-written for a single time step of k with just the network constraint modelled as shown in (7a)–(7c).
 (7a)
(7a) (7b)
(7b) (7c)
(7c)Notice that this problem is much easier to solve with an ACOPF solver. We utilise a robust ACOPF solver called NETSS [32] which is known to always converge to a feasible solution. If not, it leads through a set of diagnostics steps to still minimal feasible adjustments. This will be elaborated in detail in the Appendix.
6.1 Principles of interactive protocols for providing end-to-end services
Shown in Fig. 2 is a sketch of general DyMonDS architecture underlying DERMS management. BPS, TSO, DSO, DERs, conventional generation, microgrids, all affect each other. Two major pillars of DyMonDS framework directly relevant for interactive DERMS protocols design are as follows:
Internalising technology-specific constraints for enabling physical implementation: First, the emerging electric power systems architecture is becoming a very complex network with many distributed decision makers. DERs are representative non-utility components connecting to the network and affecting the grid. As a result, this network is hard if not impossible, to manage in a centralised manner any longer. The economic and physical effects of non-utility equipment, in particular, DERs, connected to the legacy power grid will become significant over time. To manage this new complexity, technology-specific constraints, risk preferences and willingness to contribute to societal benefits need to be modelled and internalised by the DERs themselves when deciding to be connected to the grid. For example, temporal constraints need to be internalised when planning and operating DERs. This is doable because often the DERs have more accurate information about the specifics of their technologies, and about their risk preferences than the system operators. This internalisation of temporal dependencies enables DERs to perform distributed decision-making in a model predictive way. Such an approach is computationally feasible and results in the risk of future uncertainties over time, to be locally distributed and handled by DERs and neighborhoods, thus reducing the need for expensive fast generation. There exist many new opportunities for embedding intelligence into DERs themselves to learn from historic patterns, and make a sequential decision over time which accounts for temporal inter-dependencies.
Minimal interactive coordination of physically implementable DER functionalities at value:
Second, instead of managing basic cost according to a single system-level performance metrics, the cost functions are computed by the distributed stakeholders themselves and are communicated to the higher-level aggregating/coordinating entities. These, in turn, minimally coordinate their members and send schedules and projected prices back to the stakeholders. When coordination is done, it is no longer necessary to account for the technology-specific constraints of DERs since they are already internalised when computing their cost functions. As a result, locational prices resulting from system level coordination are only caused by the T/D constraints, and not by the ramp rates, for example. This greatly simplifies accounting of the DER effects on grid requirements, planning and operations.
6.2 Proof-of-concept illustration of implementation of proposed protocols within the IEEE 14-bus system for end-to-end reliable system (contribution 4)
We consider the standard IEEE 14-bus system shown in Fig. 1. This system has one conventional generator at bus 1 and the rest of generators at locations  and 8 are small DERs. The thermal line ratings are also shown in the figure.
-
Generator 1 is a large coal unit of 250 MW. However, for the purposes of reliability, 120 MW of its capacity is set aside, making only about 232 MW available for operations
-
Generator 2 is a dirty, expensive unit which has been completely decommissioned and has been replaced with an uncontrolled wind farm, whose patterns can only be predicted to desired levels of accuracy.
-
Generators at locations 3, 6 and 8 are expensive as well and are thus decommissioned, replacing them with DERs of 20 MW capacity each to provide voltage support in times of need.
The generator characteristics have been summarised in Table 2. Notice that the conventional generation at location 1 is expensive for operations while the ones at other locations are much cheaper. Furthermore, it is assumed that the generator at bus 1 is much slower compared to the generation at other locations.
The disturbances entering this power system are the inflexible demand and the uncontrolled wind farm at bus 2, the patterns of which for a typical day are shown in Fig. 16. This information is communicated by the DERMS located at bus 2 of Fig. 1 This information is utilised by the TSO in charge of the IEEE-14 bus system coordinating with multiple DERMS at the points of interconnections of distribution feeders i.e. buses 2, 3, 6 and 8, which in turn estimate local disturbances of inflexible demand and uncontrolled renewables to produce estimations for net inflexible demand (Fig. 17).
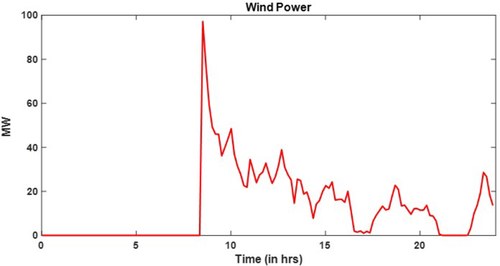
Daily patterns of wind
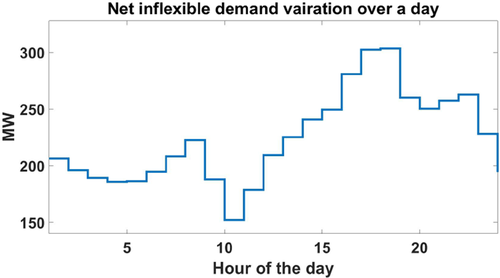
Daily patterns of net inflexible demand
As described in (5), the two pillars of the interactive protocols of DERMS are the advanced ACOPF solver capable of integrating a larger number of DERs, and the effect of MPC-enabled distributed decision-making. We assess the benefits of both of them.
6.2.1 Effect of voltage dispatch
In this first experiment, we solve the problem posed in (1a)–(1l) at each time step separately by modelling AC network constraints in (1j)–(1l). This approach to problem-solving with NETSS ACOPF (see Appendix) where voltages are optimised is compared to that when voltage is not optimised. With the voltage optimisation feature in ACOPF, it is noticed that the load for all 24 h can perfectly be tracked. However, by using just a power flow analysis tool, it is seen that the load had to be shed multiple times of the day. Furthermore, while the locational prices at each time instant were fairly uniform with voltage optimised as can be seen in Fig. 18, the cleared locational prices suffered severe excursions in the case without voltage optimization as shown in Fig. 19.
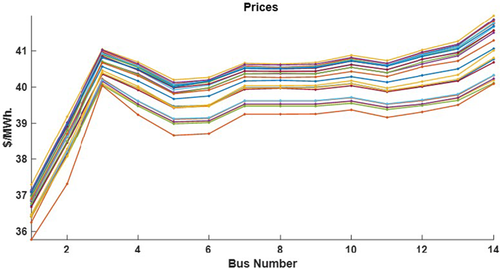
Cleared prices obtained with voltages optimised in static centralised dispatch, each line plot corresponds to one timestep
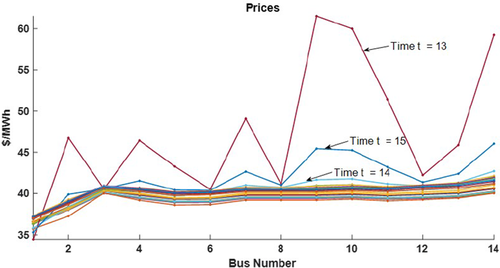
Cleared prices obtained with voltages optimised in static centralised dispatch, each line plot corresponds to one timestep
In the case where the voltage was not optimised, the loading level at t =  resulted in excessively constrained operation until the time the voltages are relaxed at time
  , resulting in sudden spikes in cleared prices. If voltage relaxation was not allowed, load would have had to be shed, indicating that the hosting capacity limit is reached with the present amount of DER penetration at 16th hour if voltage optimisation of ACOPF were not utilised.
6.2.2 Effect of embedded MPC-based decision-making
We next, compare the results obtained by our interactive approach that makes use of embedded MPC-based decision -making versus the static approach to scheduling the generating resources. For the MPC-based bidding of operations planning cost, we consider a planning horizon of 6 h. We let the generators in the IEEE 14 bus system solve the problem in (2a)–(2e) and the one at bus 2 to solve (6a)–(6c) to submit cost functions to the TSO. The TSO then utilises (7a)–(7c) to produce the generation dispatch values. It has been seen that the slow generator at bus 1 also ends up slowly chasing the increment in demand with MPC-based look-ahead bids cleared by the coordinator using ACOPF. These schedules are shown in Fig. 20 which show significant generator 1 participation, when compared to that obtained by static scheduling i.e. by solving (1a)–(1l) one time-step at a time. The results of static centralised clearing with voltage constraints result in overall generation schedules as shown in Fig. 21.
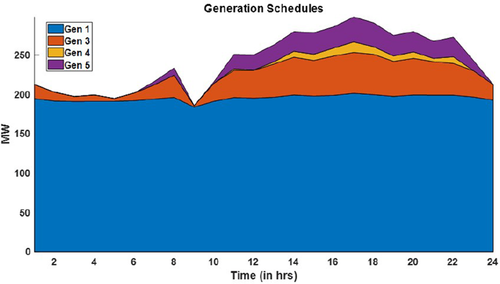
Generation schedules obtained with interactive protocols of DERMS enabled
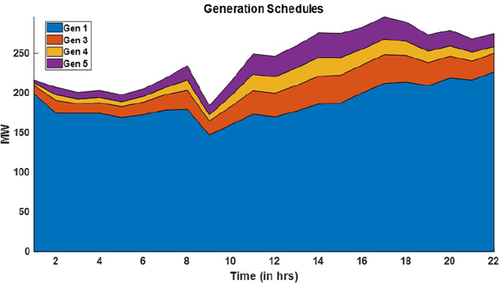
Generation schedules obtained with a static centralised approach to clearing
From these two results, it is evident that the two ingredients of our interactive protocols of DERMS indeed lead to more efficient operations. This is validated also from the cumulative metrics tabulated for these three cases in Table 3. Several conclusions can be drawn from this table. The voltage optimisation results in more number of constraints, thus resulting in slightly higher operating costs; but consumer surplus drops slightly, which means that the marginal surplus decreases by a significant amount. Now with the static ACOPF approach combined with the second pillar of interactive protocols i.e. look-ahead MPC-based bid creation, as expected the operation cost tends to be slightly higher due to increased number of constraints being binding. However, it has been noticed that the consumer bills sharply and so the marginal surplus does gown tremendously, by approximately 75%.
| Metric | Static centralised clearing | Static centralised clearing | MPC-based clearing |
|---|---|---|---|
| without voltage dispatch | WITH voltage dispatch | with voltage dispatch | |
| load shed | 0.21 | 0 | 0 |
| operating cost | 177,850 | 177,931 | 184,379 |
| generator revenues | 216,364 | 217,445 | 221,682 |
| generator profit | 28,514 (+21.65%) | 39,514 (+22.21%) | 37,302 (+20.23%) |
| consumer bills | 251,882 | 250,071 | 230,172 |
| marginal surplus | 35,517 | 32,625 | 8489.90 |
7 Reliability-related risk management for use within DERMS
As mentioned earlier in Section 4, the risks can be managed locally by the DERs themselves so that they can inject a constant amount of power injections into the grid within pre-specified variations. There however exists another type of risk such as planned or unforeseen equipment failures as modelled in (1a)–(1l) when the quantities are all appended with a superscript s with due consideration given to all possible scenarios. In such a case, the DERMS of DSO should be capable of taking online actions so that the critical load is still served. For this to happen, the preventive dispatch strategy is activated once in a while to procure enough security and spinning reserves to cater to such less probable conditions of equipment outages.
The proposed preventive strategy uses NETSS preventive dispatch module shown in Fig. 22. Today's preventive dispatch is performed by only utilising the DC power flow constraints to have computational tractability. Furthermore, only critical line contingencies are evaluated when dispatching security reserves. In contrast, the NETSS reliability module emulating preventive dispatch obeys AC power flow constraints, which is implementable. It also has an internal contingency screening sub-module embedded, that can enumerate impactful outages for procuring the reserves. As a result, the NETSS module is capable of providing an estimate of the best preventive dispatch strategy utilised in today's operations. For details on this, see [33].
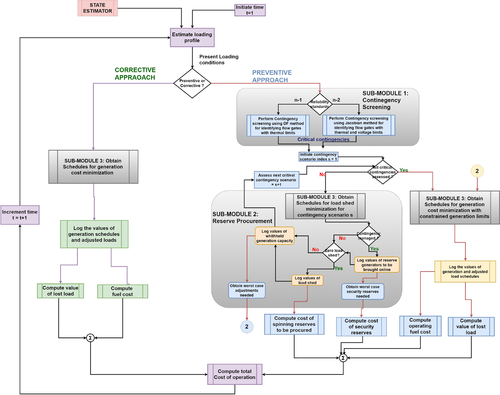
NETSS reliability module
In Fig. 22, the blocks in blue and yellow are the processing blocks of the preventive approach to obtain dispatch quantities. Specifically, the blue ones correspond to the blocks that get invoked iteratively for analysis of every contingency, to then acquire reserves for the worst scenario to then ensuring  reliability criterion. The flow gates, spinning and operating reserves are identified through this part of information flow. Spinning reserves are the ones that correspond to the additional generation that is to be procured to avoid load shedding in the event of any contingency. The security reserves typically are fast-start up generation technologies that can come online within half an hour if needed after an equipment failure happens. The spinning reserves are the one grid synchronised and can be activated near-instantaneously. The former ones are scheduled typically for low probability high impact scenarios, while the latter ones are utilised for high probability lower impact scenarios. Finally, operating reserves are the additional units that needed to be brought online because part of available generation capacity is set aside for when any contingency occurs [17]. For these constrained limits on resource availability and transfer flow capability, the preventive dispatch is performed as shown in the information flow diagram indicated through yellow blocks. Resultantly for every dispatch interval, the total cost of operation includes generation fuel cost to supply present demand, the cost of acquiring additional spinning reserves in the event of an unforeseen contingency, and finally the value of the lost load.
7.1 Proof-of-concept illustrations of interactive protocols for end-to-end reliable system with risk management (contribution 5)
In this example, the system used in Section 5.3 has been used. Generators are scheduled preventively, where in addition to energy services provision for normal operations, optimal allocation of security and spinning reserves is also performed while minimising the load shed during normal operations following the sequence of actions as in the flowchart in Fig. 22. In the preventive dispatch, first, the contingency screening is performed to identify the critical contingencies. This is done either by utilising distribution factor (DF) method, which only looks out for the possible line thermal limit violations and Jacobian method which also identifies possible voltage violations. This analysis when performed for single equipment outage identifies the critical equipment as the ones shaded in red in Figs. 23 and 24. Furthermore, since branch 1–2 is a critical contingency, its outage coupled with any other grid equipment is a valid pair of simultaneous two equipment critical contingency. In addition to these pairs, another region of the critical simultaneous outage is shaded in orange, where the loss of any two equipments in the shaded region may be critical. In total, the number of pairs of simultaneous two equipment outage has been identified to be 24 and 38 by the DF and Jacobian method, respectively.
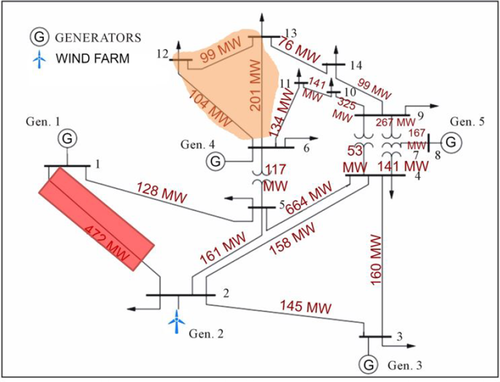
Critical contingencies identified through DF method. Shown in red are the ones obtained for n-1 screening, while the region in orange corresponds to that of n-2 contingency screening
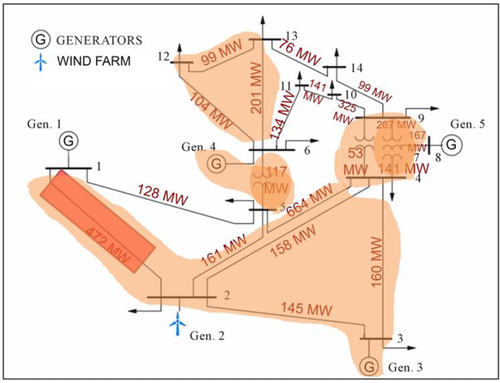
Critical contingencies identified through the Jacobian method. Shown in red are the ones obtained for  screening, while the region in orange corresponds to that of
  contingency screening
The reserve procurement for  reliability criteria for all cases was equal to zero. For
  contingency screening has been performed every 6 h resulting in the different types of reserves as shown in Fig. 25 with and without voltage dispatch.
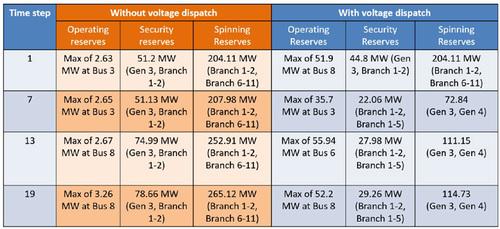
Summary of reserves procured for of n-2 reliability criteria
In this table, each entry has information about the location of the worst contingency that resulted in the procurement of security and spinning reserves. Furthermore, the operating reserves which had to be procured to avoid load shedding during normal operations because of the shortage of generation due to the component of generation set aside for reliability. from this table, one can infer that reserve location and amount of reserves change significantly as operating conditions change. With voltage dispatch that forms the crux of our proposed interactive protocols for stakeholders at upper hierarchical levels, one can decrease the amount of expensive security and spinning reserves needed while the operating reserves, as a result, will end up increases due to scarcity of generation under normal operating conditions.
The overall cumulative metrics obtained for the cases considered in Section 5.3 but with preventive dispatch are tabulated in Fig. 26. Notice the amount of savings one can have with such preventive dispatch with voltage optimisations can enhance the efficiency of operations planning. Furthermore, important is to note that the tool is capable of finding out the locational reserve requirements which have not been done previously in the existing literature.
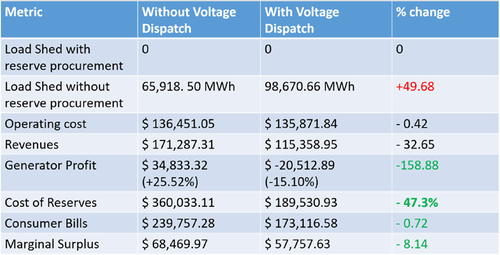
Effect of voltage optimisation on market outcomes with secure dispatch
8 Conclusions
This study offers two major contributions. It first assesses today's operations planning approaches for their ability to integrate new technologies, such as DERs. A centralised operations planning problem formulation is proposed first to be used for modelling decisions needed for reliable and efficient electricity services. The problem has both conventional controllable equipment and controllable DERs as components whose outputs need to be scheduled as system conditions change. Important for purposes of DERMS design is that the physical grid constraints, such as thermal, voltage, and stability limits, and the component constraints, such as their rate of response and capacity, can significantly affect the reliability of electricity services as well as the cumulative operating efficiency. Because of this, the proposed formulation includes these constraints when assessing new candidate technologies. However, this centralised problem formulation does not lend itself well to managing uncertainties, and its implementation falls under the category of stochastic multi-temporal non-linear optimisation, whose computational complexity becomes quickly overwhelming. As such, it is not possible to use it for on-line decision-making in large-scale T/D grids. The second contribution of this study is a new distributed interactive operation planning problem formulation which is intended to overcome this fundamental complexity. It is explained how this formulation lends itself to the changing industry in several significant ways, in addition to its potential for being less complex to implement. Instead of either assuming deterministic load scenarios and/or certain bounds on uncertain variations around the deterministic projections, the information about the ranges of likely demand and generation is provided by the distributed stakeholders themselves. The stakeholders account for their specific technological constraints, and risk preferences, and set their own distributed performance sub-objectives when determining the ranges of power and their willingness to pay/sell. This stakeholders' willingness to participate in system-level electricity services can be obtained either by exchanging information with other stakeholders multi-laterally and/or by relying on information about projected electricity prices by the aggregators and system operators. In this study, minimal interactive information exchange with the coordinating entities is described.
There are two pillars underlying principles of interactive protocols for DERMS: First, the that complexity is managed by internalising temporal dependencies, risk preferences, and technology-specific constraints as part of decision-making by the stakeholders themselves. The result of this optimisation is a physically implementable cost function, and this avoids the need to consider ramp rates when coordinating their schedules. Second, these physically implementable cost functions get communicated to the DERMS coordinator, where the optimisation gets carried out using a model that is based on static AC OPF. As a result, it produces stakeholders' schedules that are physically implementable by the grid [17]. This interactive binding information exchange leads to near-optimal physically implementable participation of DERs in the actual operation when electricity services need to be delivered. This approach forms the basis for the DERMS computer platform, and the architecture offers ways to enhance the ability of T/D grid to integrate DERs. This ability has recently been referred to as the dynamic hosting capacity. A flow-chart is given to show the basic information flow of interactive protocols. The taxonomy Table 1 serves as a guide for the follow-up sections that describe three different aspects of the proposed protocols.
The role of T/D grid owners and operators in enabling reliable and efficient electricity services by systems with DERs is enormous. The T/D grid owners can use DERMS based on interactive protocols to even assess candidate DER investments and to select the ones near-optimal for their end users and for meeting societal system-level objectives. This area of research can be pursued in the future as a straightforward extension of the proposed framework for operations planning to that of investment planning. The accommodation of the increased number of DERs facilitated by DERMS is also supposed to be analysed for dynamic system stability which needs to be studied in more detail.
Appendix 10: features of the extended AC OPF used
The core software description of the NETSS Extended ACOPF can be found in [34]. A modified version of it is shown through blocks in Fig. 27.
It essentially runs through a series of optimization problems until it arrives at the global optimum. This block is general enough to be utilized both for normal and in the event of contingencies. It provides a choice of four types of objective functions while computing the control actions.These are real power generation cost minimization (OPF), reactive power generation cost minimization (OQF), apparent power cost minimization (OSF), extreme voltage minimization (MXV), optimum load dispatch (OLD), optimum branch flow allocation (OBF).
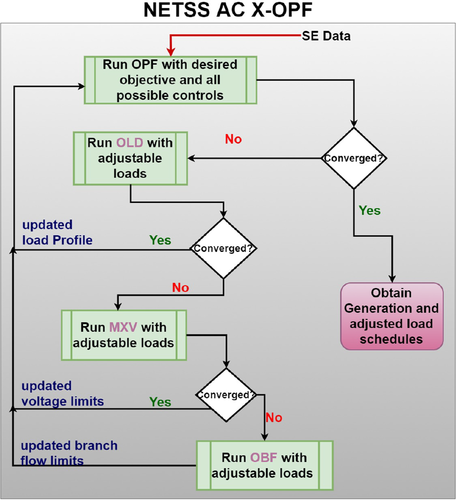
NETSS AC X-OPF module
Most commonly utilized cost function for normal operation is that corresponding to real power generation costs, i.e. OPF. However, during extreme events, NETSS is capable of selecting the objective function adaptively until it finds a feasible solution. More details on this aspect can be found in [34]. The simplest example of an event occurrence is when there is an equipment outage. During such circumstances, the user may be more interested in serving more load rather than minimizing generation cost. This software module while allowing for adaptive objective functions to be chosen, it can also permit human intervention to take system-specific decisions.
This task appears to require human intervention to a large extent, but it has been automated as shown in Fig. 27, so that there always is a possible solution strategy that can be found. The green computation blocks in Fig. 27 correspond to each of NETSS runs with different objective functions. The actions taken while traversing through each block are logged in the files to be accessed later for making improvements to the grid. In the context of the reliability module, the ultimate objective is to minimize the system-level cost. Thus generation cost minimization is run first. If this fails, it may be either because of extreme voltages at certain locations or excessive load at some location that can not be served either due to steady state transfer capability limits or due to thermal line flow limits. To identify potential causes creating the issues with observing one or several of the limits on voltages, or load to be served or branch flow limits can be relaxed to find a feasible solution. Momentary isolations sometimes for shorter periods are permissible. Alternatively, if the frequency of such operations is high, a business case can be made to install additional smarts on respective equipment. For instance, the load shed minimization can be implemented in a more consumer-oriented way by embedding smarts on devices facilitating shifting the time of use [35]. The over or under voltage issues can be avoided by installing shunts of reactors or voltage controlling transformers at the right locations on the grid, a study of which has been conducted by NETSS previously to identify even the optimal locations of such installations. Finally, the phase angle regulators and/or other FACTS devices can be installed on existing wires to increase the transfer capability.
One possible implementation of AC Extended (X)-OPF is shown in Fig. 27 where the desired objective is attempted to be minimized while observing all the grid constraints. If this fails, then the software automatically chooses to allow for slight violations but attempts to minimize them. This is also facilitated with the aid of adjustable load. With all these relaxation applied to the ACOPF problem, there always exists a solution in most cases except when branch flows are binding. The solution is then utilized to re-solve the problem for the objective of interest. This method will result in achieving the optimum with respect to the desired objective with minimum possible violations and/or load shedding.


